
All models are wrong, but some are useful. — British Statistician George E. P. Box
This classic quote largely credited to statistician George Box perfectly sums up the challenge of decision-making in turfgrass management. It captures every superintendent’s daily reality: we try to tame a living, chaotic system—weather, soil, grass, golfers—by boiling it down to a handful of numbers we can act on. Whether it’s predicting next week’s weather or scheduling your next wetting agent application, every model simplifies a complex reality. That simplification introduces uncertainty—but when used correctly, models can be an invaluable tool for turf managers.
Take weather forecasts as an example. At the time I wrote this post, I noticed a forecast calling for record breakding 111°F next week in Nebraska. Will it really be that hot? Probably not—but it’s a good reminder that forecasts are models, and models are estimates based on probabilities.

What Are Models?
A model is simply a mathematical representation of a complex system. In turfgrass management, that can include:
- Weather Forecast Models – Predicting temperature, rainfall, humidity, and more.
- Growth Models – Using growing degree days (GDD) to estimate plant development and recovery.
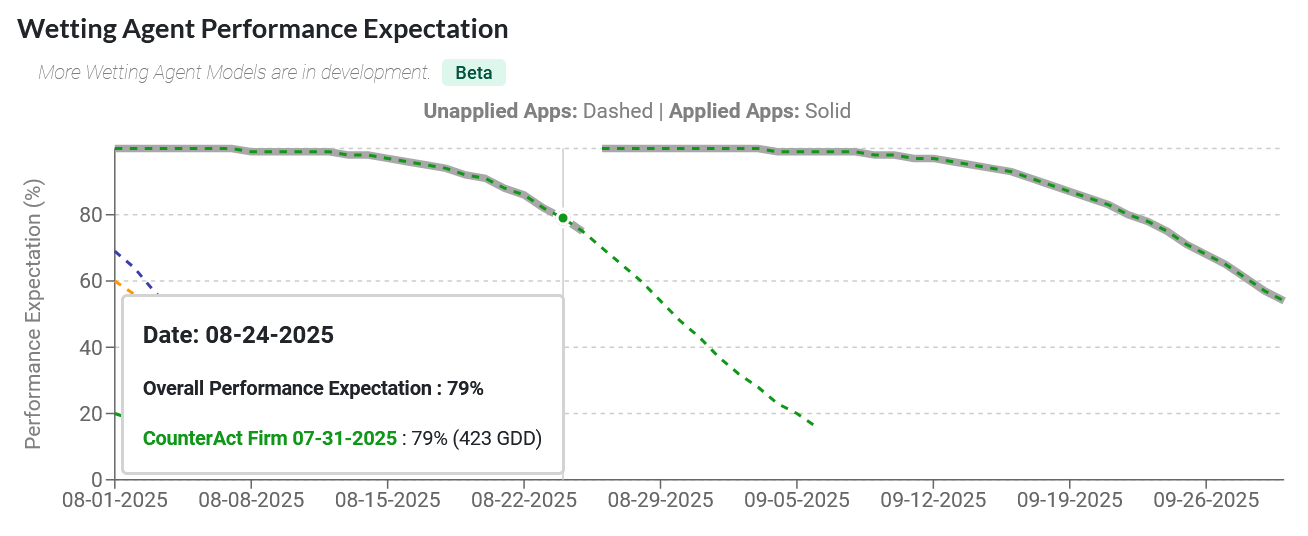
- Agronomic Timing Models – Scheduling PGR or DMI re-applications, wetting agent intervals, and disease prevention sprays.
- Pest Risk Models – Estimating the likelihood of insect or disease outbreaks.
Even something as simple as a 14-day reapplication interval is a basic model—it’s a rule of thumb derived from research and experience.

How Models Can Be Wrong… and Still Helpful?
Long-range weather models are a perfect example of this concept. Global forecasting weather models like GFS, ECMWF, and GEM use different equations, assumptions, and data inputs, so their outputs often vary. One model might predict an extreme heat dome over Nebraska, while others show a more moderate warm-up. Which one is right?
In reality, none of them will be perfectly accurate—but together, they paint a useful picture: next week will likely be warm, and there’s a small chance it could be very hot. That insight gives turf managers a head start to adjust irrigation schedules, plan hand-watering, or delay cultural practices that induce stress.

What Counts as a Model in Turf?
(More Than You Think)
This same principle applies to turf-specific models inside GreenKeeper App. Here are a few of the 800+ that add value to our users:
- Calendar Intervals – “Spray a fungicide every 14 days.”
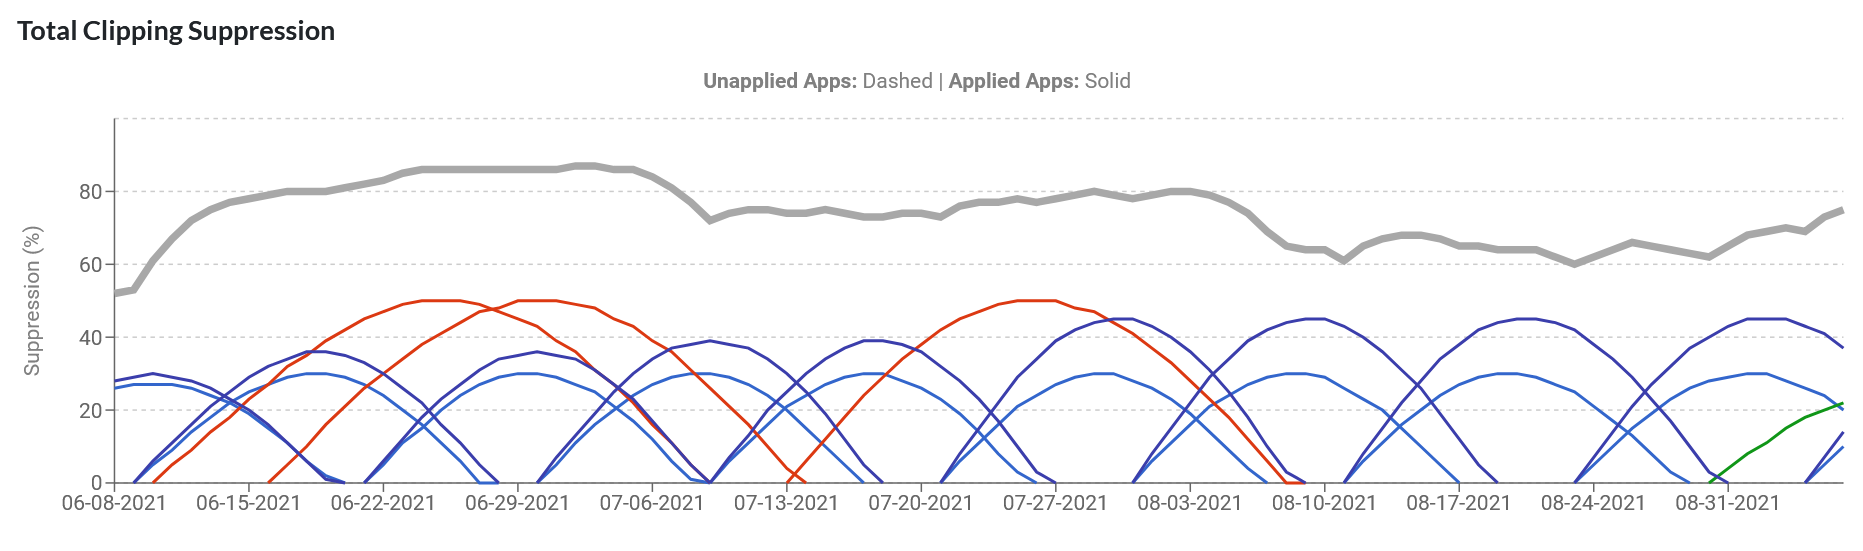
- Growing Degree‑Day (GDD) Schedules – PGR and DMI re‑applications tied to cumulative heat units.
- Phenology Triggers – Proxy® seed‑head suppression based on plant development stages.
- Pest Risk Models – Soil temp + moisture thresholds cue fungicide, insecticide, or herbicide scouting.
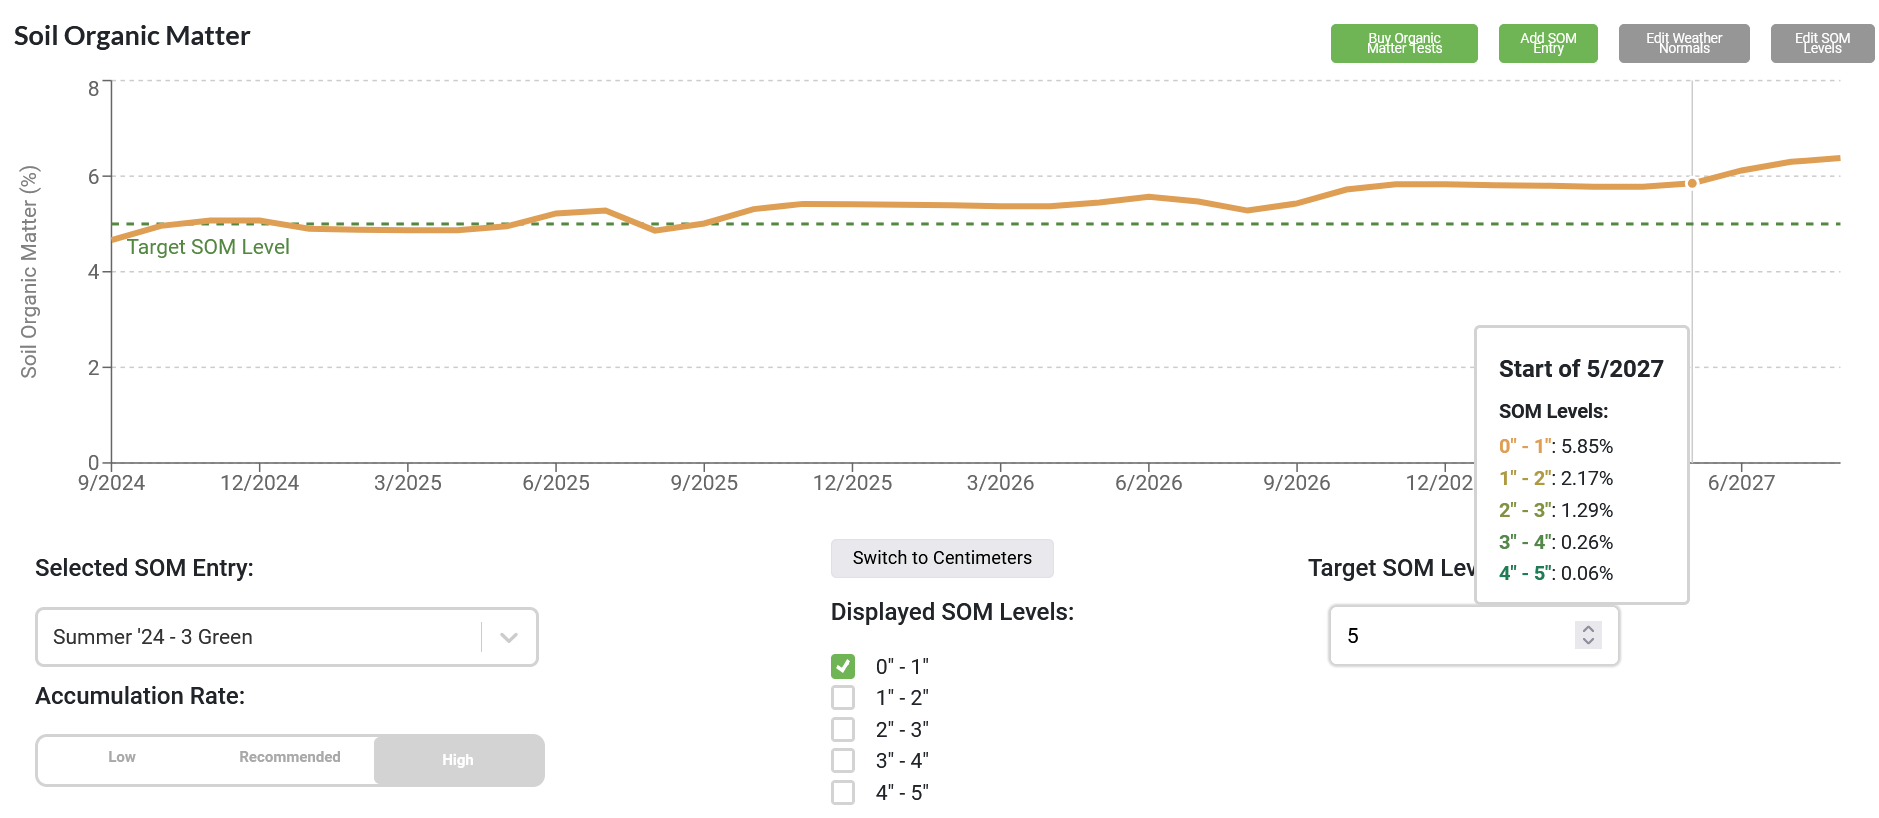
- Performance Feedback Loops – Clipping‑yield targets or clipping volume per 1,000 sq ft guiding nitrogen rates.
GreenKeeper bundles these into dashboards so you spend less time number‑crunching and more time making calls.
Simple but Actionable Data: The Fuel That Makes Models Go
Whenever I write or speak about data collection I always emphasise balancing time, accuracy, and value of the data being collected. More data can help—but only if it’s going to drive an tangable management decision. Collecting clippings from every putting green, for example, can generate a lot of data, but how are you going to use it? Are you going to treat the greens differently with PGRs or fertilizers? If not, then find a few representative greens and measure those. Alternatively, measure clippings from an average, high and low performing green to understand the growth differences.
Some of the most powerful management metrics are simple to obtain:
- Local Weather Data – Add a GreenKeeper RECON wX Station to capture your local weather conditions.
- Clipping Volume in a Graduated Bucket – The single most actionable growth rate metric I collected while working at Jim Ager Golf Course. It’s fast, cheap, and directly tied to fertility & PGR decisions.
- Stimpmeter – If golfers and managers assess the condition of a course on its greens, then it makes sense to measure green speed and visually estimate smoothness daily.
- Hand‑Held Soil Moisture Meters – Still the gold standard for spot checks and handwatering. Enter the average value into GreenKeeper’s Water Resource Planner to recieve irrigation scheduling guidance.
- Mower‑Mounted Canopy Sensors – High‑resolution spatial data while you mow anyway. Stay ahead of stress and map areas that need extra attention.

The combination of data, models, and now machine learning is transforming turf management. GreenKeeper Apps Software Engineers and Data Analysts are actively creating new ways to gain insights from your own data.
From predicting growth regulator rebound to optimizing water resources, these tools aren’t just for research—they’re built for real-world use. They won’t eliminate uncertainty, but they’ll give you an edge.
Below is a step‑by‑step process you can adopt immediately, whether you run a championship golf course, a municipal sports complex, or a professional stadium.
A Practical Workflow: Calibrate, Monitor, Adjust, Repeat
- Define the Decision. Do I need to irrigate tonight? Re‑apply PGR? Spray wetting agent?
- Pick the Right Model. Calendar interval, GDD, or soil moisture forecast.
- Enter / Collect Local Data. Weather station sync, soil moisture readings, clipping volume, mow with a Turf Vision Sensor to measure fairway health.
- Set Thresholds. Wilt point VWC, GDD target, acceptable color, labor budget.
- Run the Scenario. Use Water Resource Planner or schedule tools to see where you’ll be tomorrow or next week under different weather scenarios.
- Act & Record. Apply, irrigate, or hold. Log what you did.
- Validate & Adjust. Compare actual outcomes (moisture next morning, clipping yield, stress maps) to model predictions. Update parameters.
Key Takeaways
- Models aren’t truth—they’re decision aids. Use them to assess risk, gain understanding, and prioritize action.
- Everything you schedule is a model. Calendar intervals, GDDs, wilt thresholds, and even gut feel—write them down and improve them. Documenting these observations is by definition collecting data.
- Small, consistent data collection beats big, inconsistent data. A clipped bucket every mow is worth more than measuring every green once and a while.
- Automation + AI extend your reach. Sensors feed models; models return guidance; you save labor, water, and product.
- GreenKeeper ties it together. Weather, agronomy, sensors, machine learning—one platform to support the daily calls that matter.
Let data, models, and machine‑learning technologies augment—not replace—your agronomic expertise. That’s our mission at GreenKeeper App. When you combine informed intuition with calibrated models, you make faster calls, reduce wasted inputs, and keep surfaces performing at their best.

Ready to get more from your data? Log into GreenKeeper App, connect your weather station, and start feeding the Water Resource Planner today.
Have questions or want help setting up models at your site? Reach out—we’re happy to walk through your data and get you started.