
Today’s weather forecast shows a 10% chance of rain in the late morning. Do you throw your rain gear in the cart? What if the forecast shows a 30% chance at 7:00 a.m.?
Even without formal training in statistics, we use probabilities like these to make practical decisions throughout the day. Turf managers do the same when scheduling irrigation, planning fertilizer applications, or deciding where to send staff and equipment. The goal is always the same: reduce uncertainty and act with confidence.
Remote sensing technologies aim to aid decision making by showing spatial variability across a facility, whether data comes from drones, satellites, or GreenKeeper’s Turf Vision sensors. But too often, these technologies only produce visually impressive maps that color relative differences without providing clear meaning. A map may highlight variation, but does it tell you whether that variation matters or whether it justifies action?
A Familiar Frustration
Many superintendents and researchers have experimented with drone-based multispectral programs over the past 20 years, often finding the same thing — visually interesting data that was difficult to act on consistently from week to week. That experience has left many understandably skeptical of multispectral technology altogether. But the limiting factor wasn’t the concept itself — using light reflectance to measure plant health is sound science. The limitations were two-fold: the day-to-day inconsistency of passive sensor data that shifts with lighting conditions, cloud cover, and season, and the lack of software capable of capturing and re-calibrating maps using ground truth data from a specific facility. Without consistent measurements and without a way to teach the system what acceptable turf looks like on your course, even good data stays decorative. That’s exactly what the active sensor in Turf Vision and the Scouting Tool are designed to solve — together.

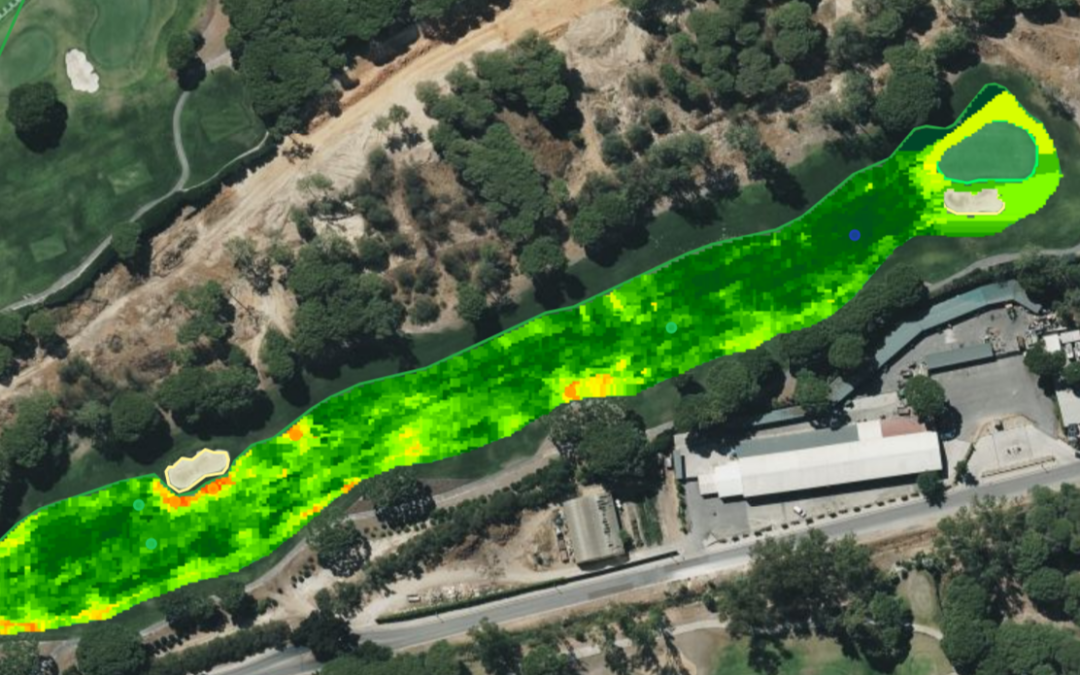
The map colors were generated from simple scouting data and represent the probability that the turf meets quality expectations. Orange represents less than a 20% probability that the turf is acceptable. Yellow represents a 50% probability that the turf is acceptable. Light and dark green represent an 80% and 95% probability, respectively, that the turf at that location is of acceptable quality.
Teaching GreenKeeper How to Interpret the Map
The Scouting Tool in GreenKeeper CIS translates hundreds of thousands of data points collected during mowing into a probability map showing whether turf is acceptable or unacceptable — which is much closer to how turf managers actually think and make decisions. After mowers return to the shop, the aX logger sends data to GreenKeeper and new maps are generated automatically within minutes.
Adding scout data is straightforward. Users can see their location on the map while driving the course, then click Report Scouting in CIS to rate turf in a 10-foot-diameter circle as simply acceptable or unacceptable. That binary input is more powerful than it might seem. GreenKeeper’s regression models use those field observations to learn the relationship between Turf Vision sensor readings and actual turf conditions at your facility — translating raw sensor data into the probability that any given point on the map meets your expectations. By scouting just a dozen locations across your fairways, the system begins producing a map that reflects real operational meaning, not simply colors stretched across a data histogram or anchored to arbitrary breakpoints.
Ground-truthing in GreenKeeper CIS is simple. Click on the map and specify if the turf in that 10 foot diameter circle meet your expectations. Regression models use this data to assign a probability table to color the sensor data accordingly.
Interpret With Caution
When TDR probes gained widespread adoption in turf management, superintendents didn’t just start using the numbers out of the box — they built understanding by measuring turf they knew was wet, ideal, beginning to show wilt, and actively wilting. Over time, those field observations turned raw numbers into actionable thresholds meaningful for their specific turf, soils, and conditions.
The Scouting Tool follows that same philosophy of calibration, just applied to canopy health rather than soil moisture. By recording whether turf is acceptable or unacceptable at locations across your course, you’re teaching GreenKeeper what the Turf Vision sensor readings mean on your property — building facility-specific understanding the same way superintendents once built meaningful moisture thresholds with a TDR probe.
That ground truthing step matters more than some emerging platforms suggest. A growing number of passive sensor systems claim they can automatically identify nutrient deficiencies, diseases, and stress events across your course — without any facility-specific calibration. It’s a compelling pitch, but peer-reviewed research validating those claims remains limited. A passive system trained on generalized data from experimental turf fields is not the same as a system trained on your turf, your soils, and your management program. No algorithm built somewhere else knows what acceptable looks like on your course. You do — and that’s exactly why the Scouting Tool puts you at the center of the process.

A real-world comparison of an active rX sensor on the GreenKeeper Turf Vision System compared to a passive sensor technology in mid-fall. Tree shadows significantly affect the quality of the scan with the passive sensor while the rX sensor documents high performing turf across the fairways.
Automate the Data. Make Confident Decisions.
The Scouting Tool becomes more valuable as it receives more field observations. Acceptable turf isn’t defined the same way everywhere — expectations and reflectance signatures vary across facilities based on turf species, mowing height, soils, irrigation, traffic, and management goals. As more observations are collected, the system continues learning from field feedback rather than relying on generic assumptions. Current research is expanding the Scouting Tool further, aiming to not only predict whether turf is unacceptable, but to help classify why.
GreenKeeper RECON sensors help automate data collection so turf managers can spend less time gathering information and more time making decisions. Whether it’s a GreenKeeper wX weather station, a Turf Vision system paired with the CIS Scouting Tool, or other connected technologies include POGO, SPIIO and Soil Scout sensors, GreenKeeper brings both the data and the analysis together — helping you make more confident decisions, every time you’re out on the course.