
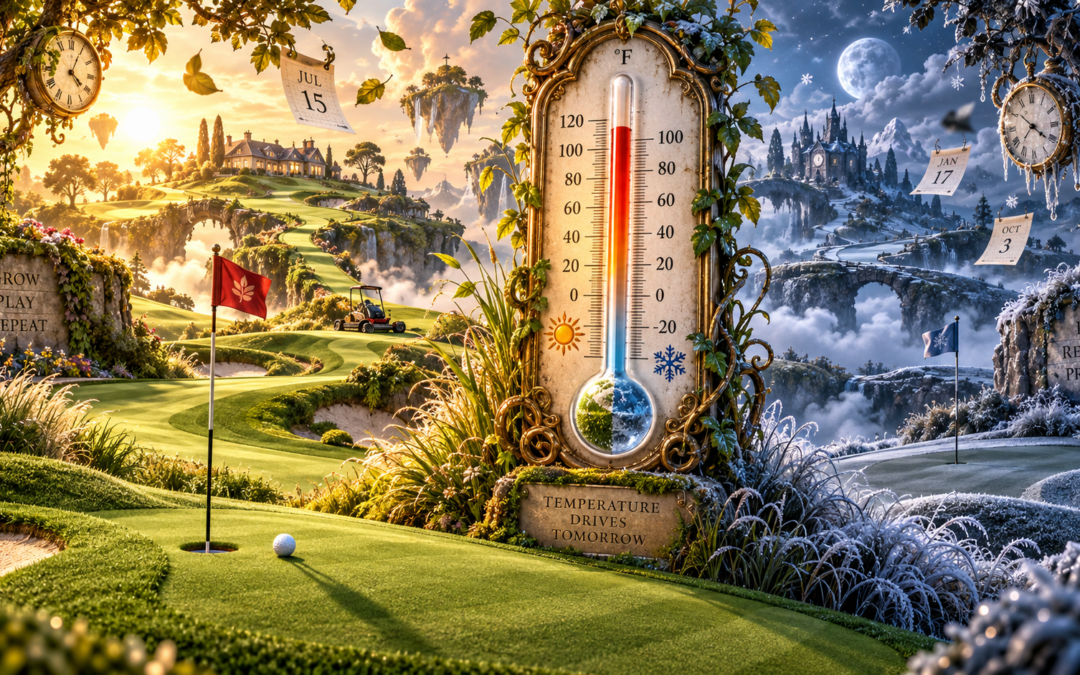
GreenKeeper Growth Series Part 2
In the first article of the GreenKeeper Growth Series, we used nearly 500,000 clipping-volume measurements to examine how much putting greens actually grow. One of the clearest environmental signals associated with that growth was temperature. This week, we are taking a closer look at why temperature is so useful for measuring biological time—and why a calendar interval can be misleading even when the number of days is identical.
Fourteen days are not always the same
A superintendent can apply the same PGR on April 15 and July 15, return exactly 14 days later, and have experienced two very different amounts of biological time. While the calendar treats those intervals as the same, temperature-dependent plant physiological processes do not.
I use the analogy of reptiles and other cold-blooded animals when discussing heat accumulation and biological activity. A snake on a cold morning is far less active than on a sunny afternoon. Why? Their bodies warm and they become physiologically more active. Plants are obviously not reptiles, but they share an important constraint: they do not maintain a constant internal temperature like mammals. Their metabolism, development, and many biochemical processes speed up or slow down as the surrounding temperature changes.
Growing degree days a simple and man-made system to keep time with temperature instead of the calendar days. Warm conditions accumulate thermal time (GDDs) quickly. Cool conditions accumulate it slowly. When temperature falls below a base temperature, the clock effectively stops. That is why GDD-based timing has been so useful for tracking processes such as PGR persistence for 20 years now.
How fast is the thermal clock ticking?
To make that idea tangible, we used environmental data from GreenKeeper App 20-year records to calculate weather normals from five U.S. locations. We then calculated thermal time in GDDs using a 0°C base temperature. We then asked how many calendar days would be required to accumulate the 200 GDDs – the recommended re-application interval of Primo MAXX (trinexapac-ethyl) on cool-season greens.
The seasonal difference is striking across these geographic locations. In Minneapolis, MN, 200 GDD accumulate in about 9 days when the count begins July 1. Start the same count on November 1 and it takes about 166 days, carrying the interval into the following spring. The thermal target is identical; only the rate at which the environment advances the biological clock has changed.
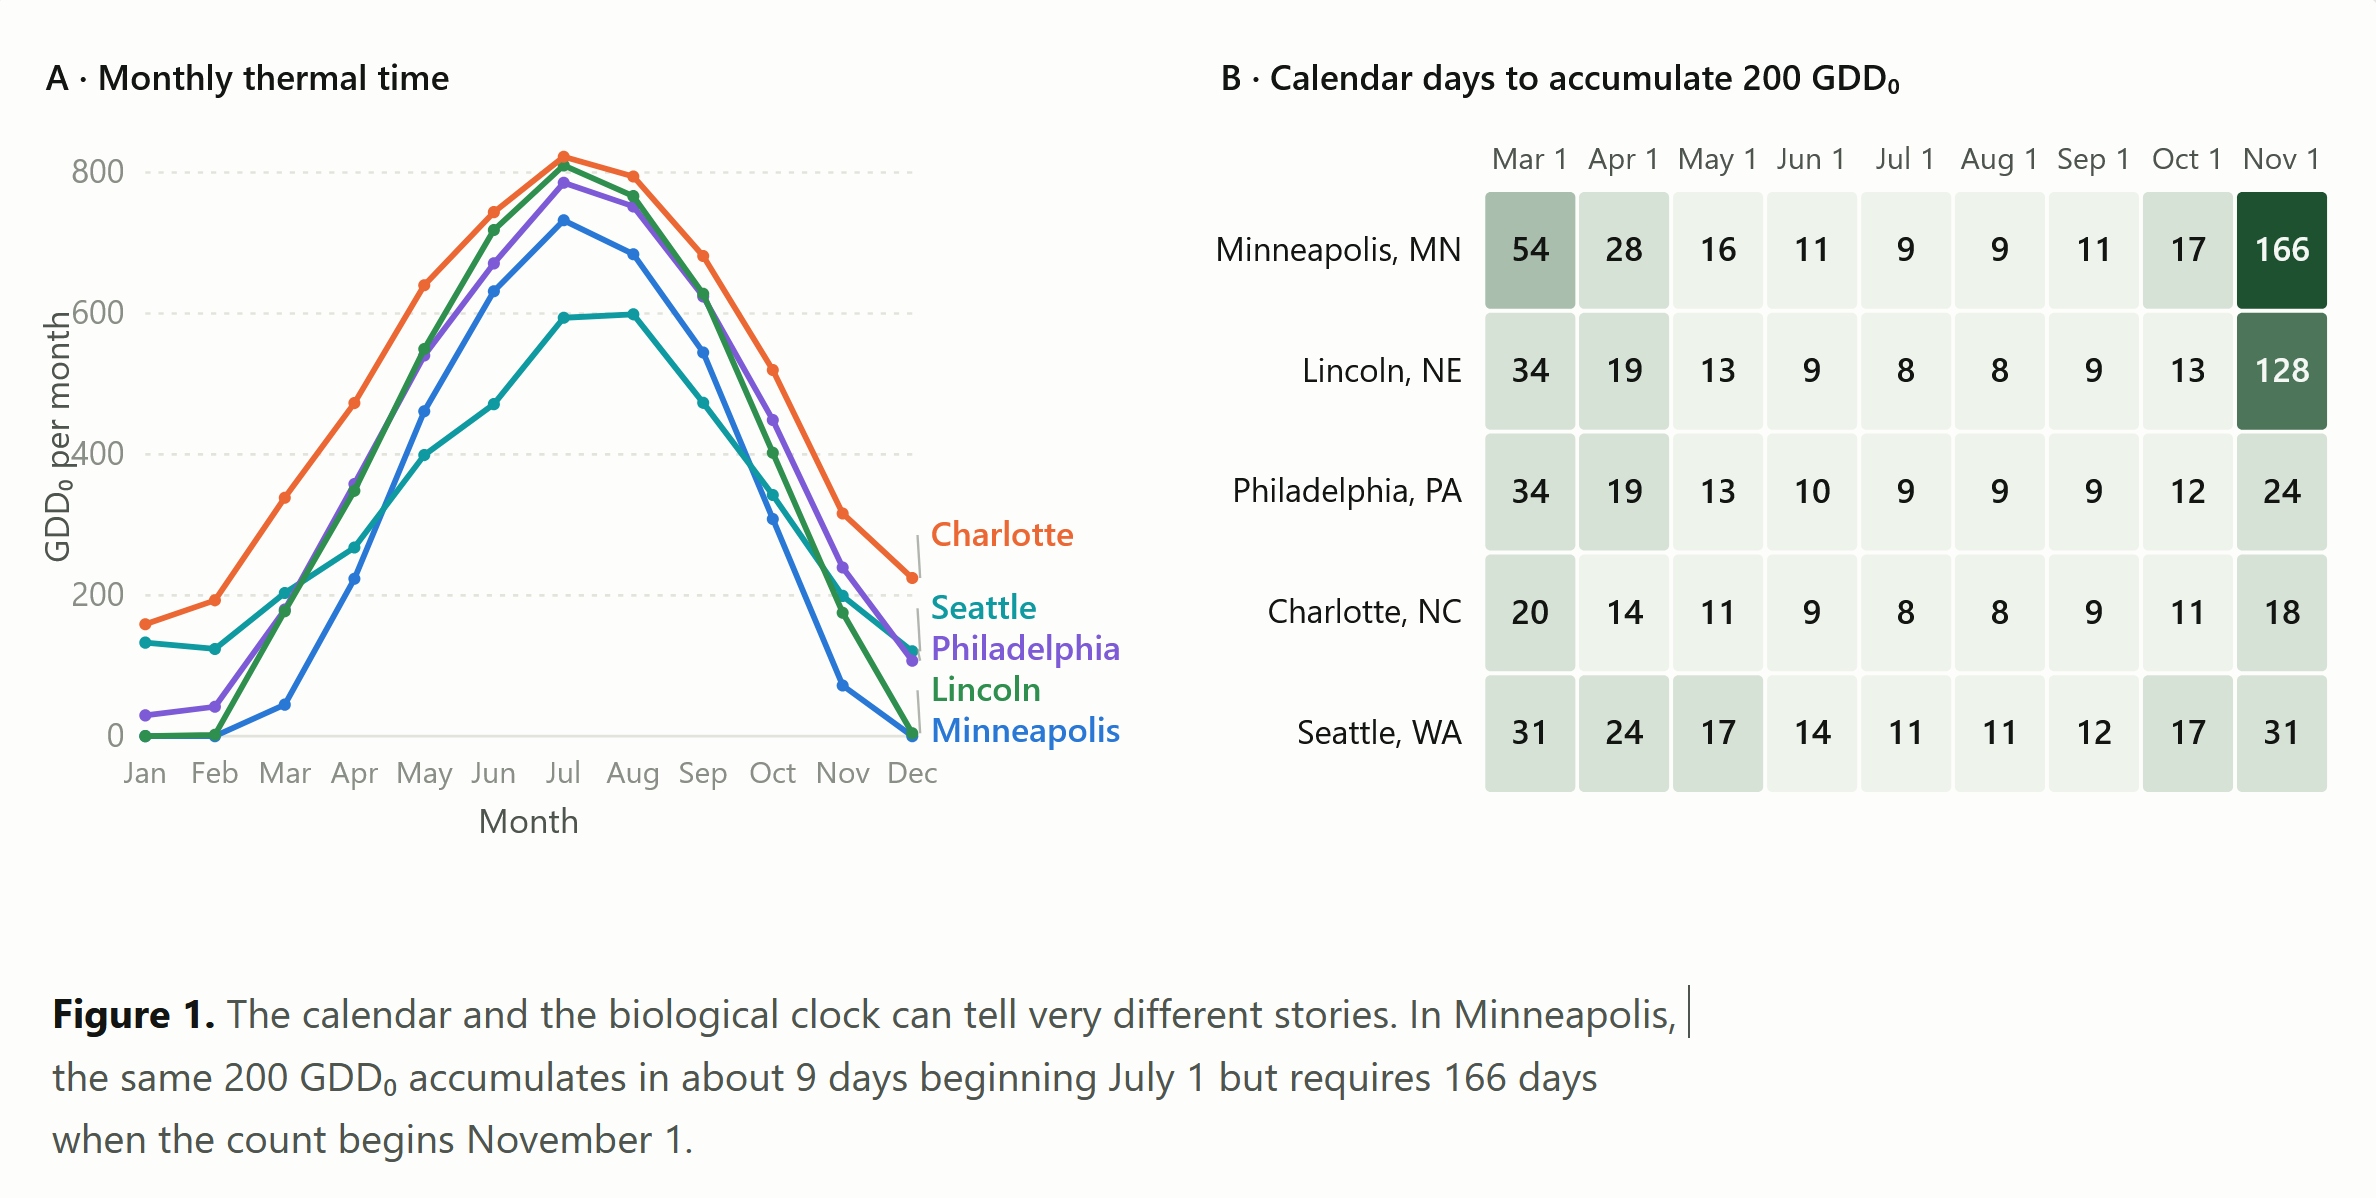
The figure shows why broad regional assumptions can be misleading. During midsummer, all five locations accumulate 200 GDD in roughly 8 to 11 days. By late fall, the same locations separate dramatically. And these assumpt perfectly normal and uniform weather – something that is becoming increasingly rare. For a temperature-driven process, recent weather and season can therefore change the meaning of a fixed calendar interval as much as—or more than—geography.
A clock is not a growth model
There is an important distinction in that statement. A GDD total does not predict how many quarts of clippings should be collected from a green. It provides a thermal-time coordinate for a temperature-sensitive process. Actual canopy growth is the integrated result of temperature, nitrogen availability, water, light, plant stress, PGR activity, turf species, mowing, and other management and environmental influences.
That distinction is also why measured clipping volume remains so valuable. GDD helps establish where a temperature-dependent process is likely to be in its progression; clipping volume quantifies the realized aboveground growth that reached the mower under the combined influence of weather and management. One provides biological context (GDD models). The other provides direct feedback from the turf (measured clipping volume).
Clipping volume measurements are also remarkably practical. Once measurement becomes part of the mowing routine, it requires little additional effort, yet the value of the record compounds over time. A single measurement describes that morning’s growth. A season of measurements begins to define what normal growth looks like for a particular golf course and makes changes following weather, fertility, PGR applications, or stress much easier to recognize.
What GDD Can and Cannot Tell Us
We made this distinction in a past article from 2020, Clipping Volume vs. PGR GDD Models: Which Is More Important? GDD models and clipping volume answer different questions. Thermal time helps estimate the progression of a temperature-sensitive process, while clipping volume quantifies the leaf growth being produced under the combined influence of weather and management. Neither replaces the other, and they become more useful when interpreted together.
GreenKeeper brings those measurements into the same place so you can track clipping volume, follow GDD-based PGR models, and begin building a clearer picture of how your own greens respond through the season. If you are not already recording clipping volume in GreenKeeper, this is an easy place to start.
Next week: We’ll look beyond temperature at the other environmental and management factors that determine how quickly putting greens grow.