
GreenKeeper Growth Series
This launches the GreenKeeper Growth Series: an ongoing look at what we’ve learned from 500,000 clipping volume observations. Over the coming weeks, we’ll use this dataset to explore how putting greens grow, how factors like weather, fertility and PGRs influence growth rate, and how different growth models perform under real golf-course conditions. Our goal is help turf managers understand how different factors or management decisions impact putting green growth rate.
How much grass was in the buckets today?
Is it is a question superintendents commonly ask equipment operators after mowing greens. The response provides a quick sense of how much the greens is growing. Increased clippings might be related to changing weather, suggest that a nitrogen response is developing, or indicate that PGR regulation is beginning to fade. Less may suggest PGR regulation is intensifying, growth conditions have worsened, or the turf is under stress.
Increasingly, superintendents are taking this question to the next level and actually measuring and recording clipping volume. The practice is simple: collect the clippings from a representative green, measure the volume (not weight), and normalize that value for the size of the green, and writing down that daily value.
Growth rate influences putting green performance, turf health, recovery from traffic, nutrient demand, mowing requirements, and the amount of PGR regulation needed. Once growth is recorded consistently, a superintendent can move beyond remembering that “we had a lot of grass this week” and begin comparing growth with green speed, turf quality, fertility, weather, and previous management decisions.
For anyone new to the process, we previously put together a short guide on how and why to measure clipping volume: Understanding Clipping Volume: How to and Why Explained
Hundreds of GreenKeeper users have been recording #ClipVol measurements for years, and the accumulated dataset has reached a scale where we can begin asking questions that extend far beyond an individual golf course. Our recent analysis included 492,062 quality-controlled clipping volume measurement from 234 golf courses collected between 2018 and 2026. Alongside those measurements are more than 62,000 nitrogen applications and 38,000 PGR applications associated with GreenKeeper growing-degree-day models.
So, how much does a putting green actually grow?
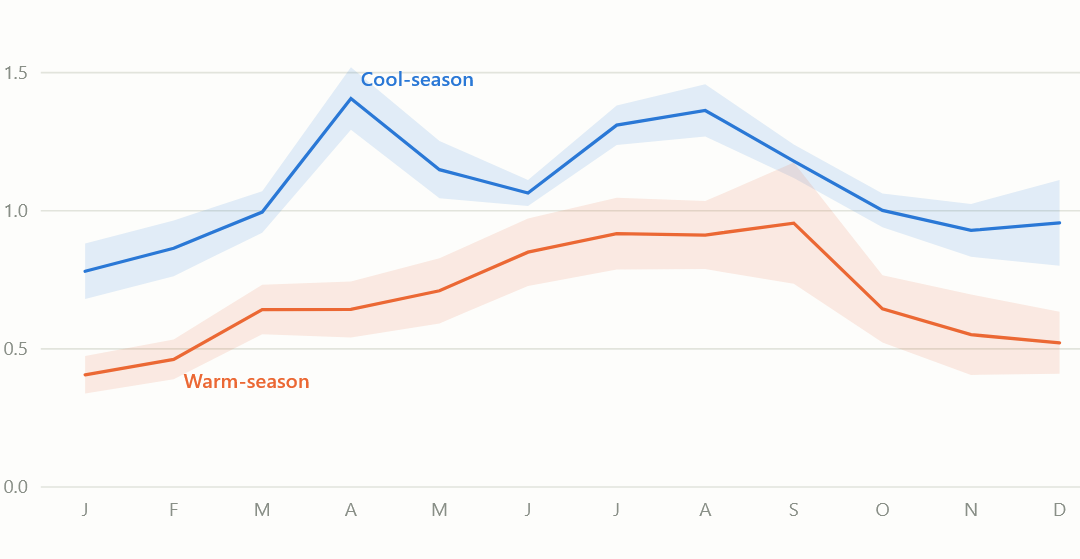
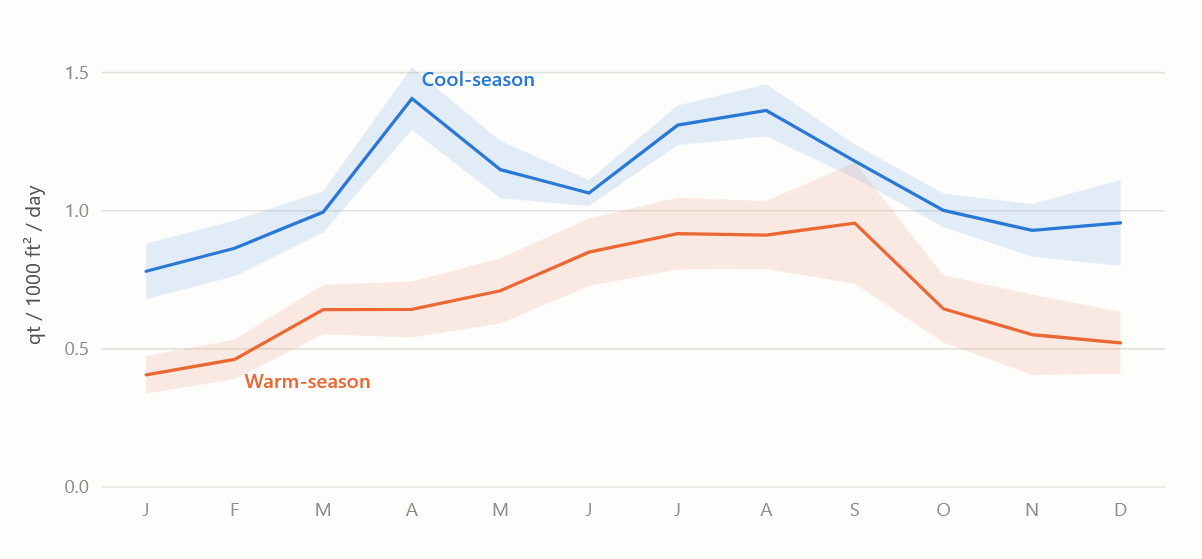
Across the dataset, cool-season putting greens had a median daily clipping yield of about 0.85 quarts per 1,000 square feet, with the middle half of observations ranging from approximately 0.48 to 1.44 quarts. Warm-season greens produced less clipping volume overall, with a median near 0.51 quarts and a middle range of approximately 0.29 to 0.90. The dataset is weighted heavily toward cool-season putting greens, which account for substantially more of the nearly 500,000 observations than warm-season greens.
Those values are not meant to be targets. In fact, the variation may be more useful than the averages. Cool-season greens generally showed a strong spring flush followed by another increase during summer, while warm-season greens built more gradually through summer and reached their highest clipping production later in the season.
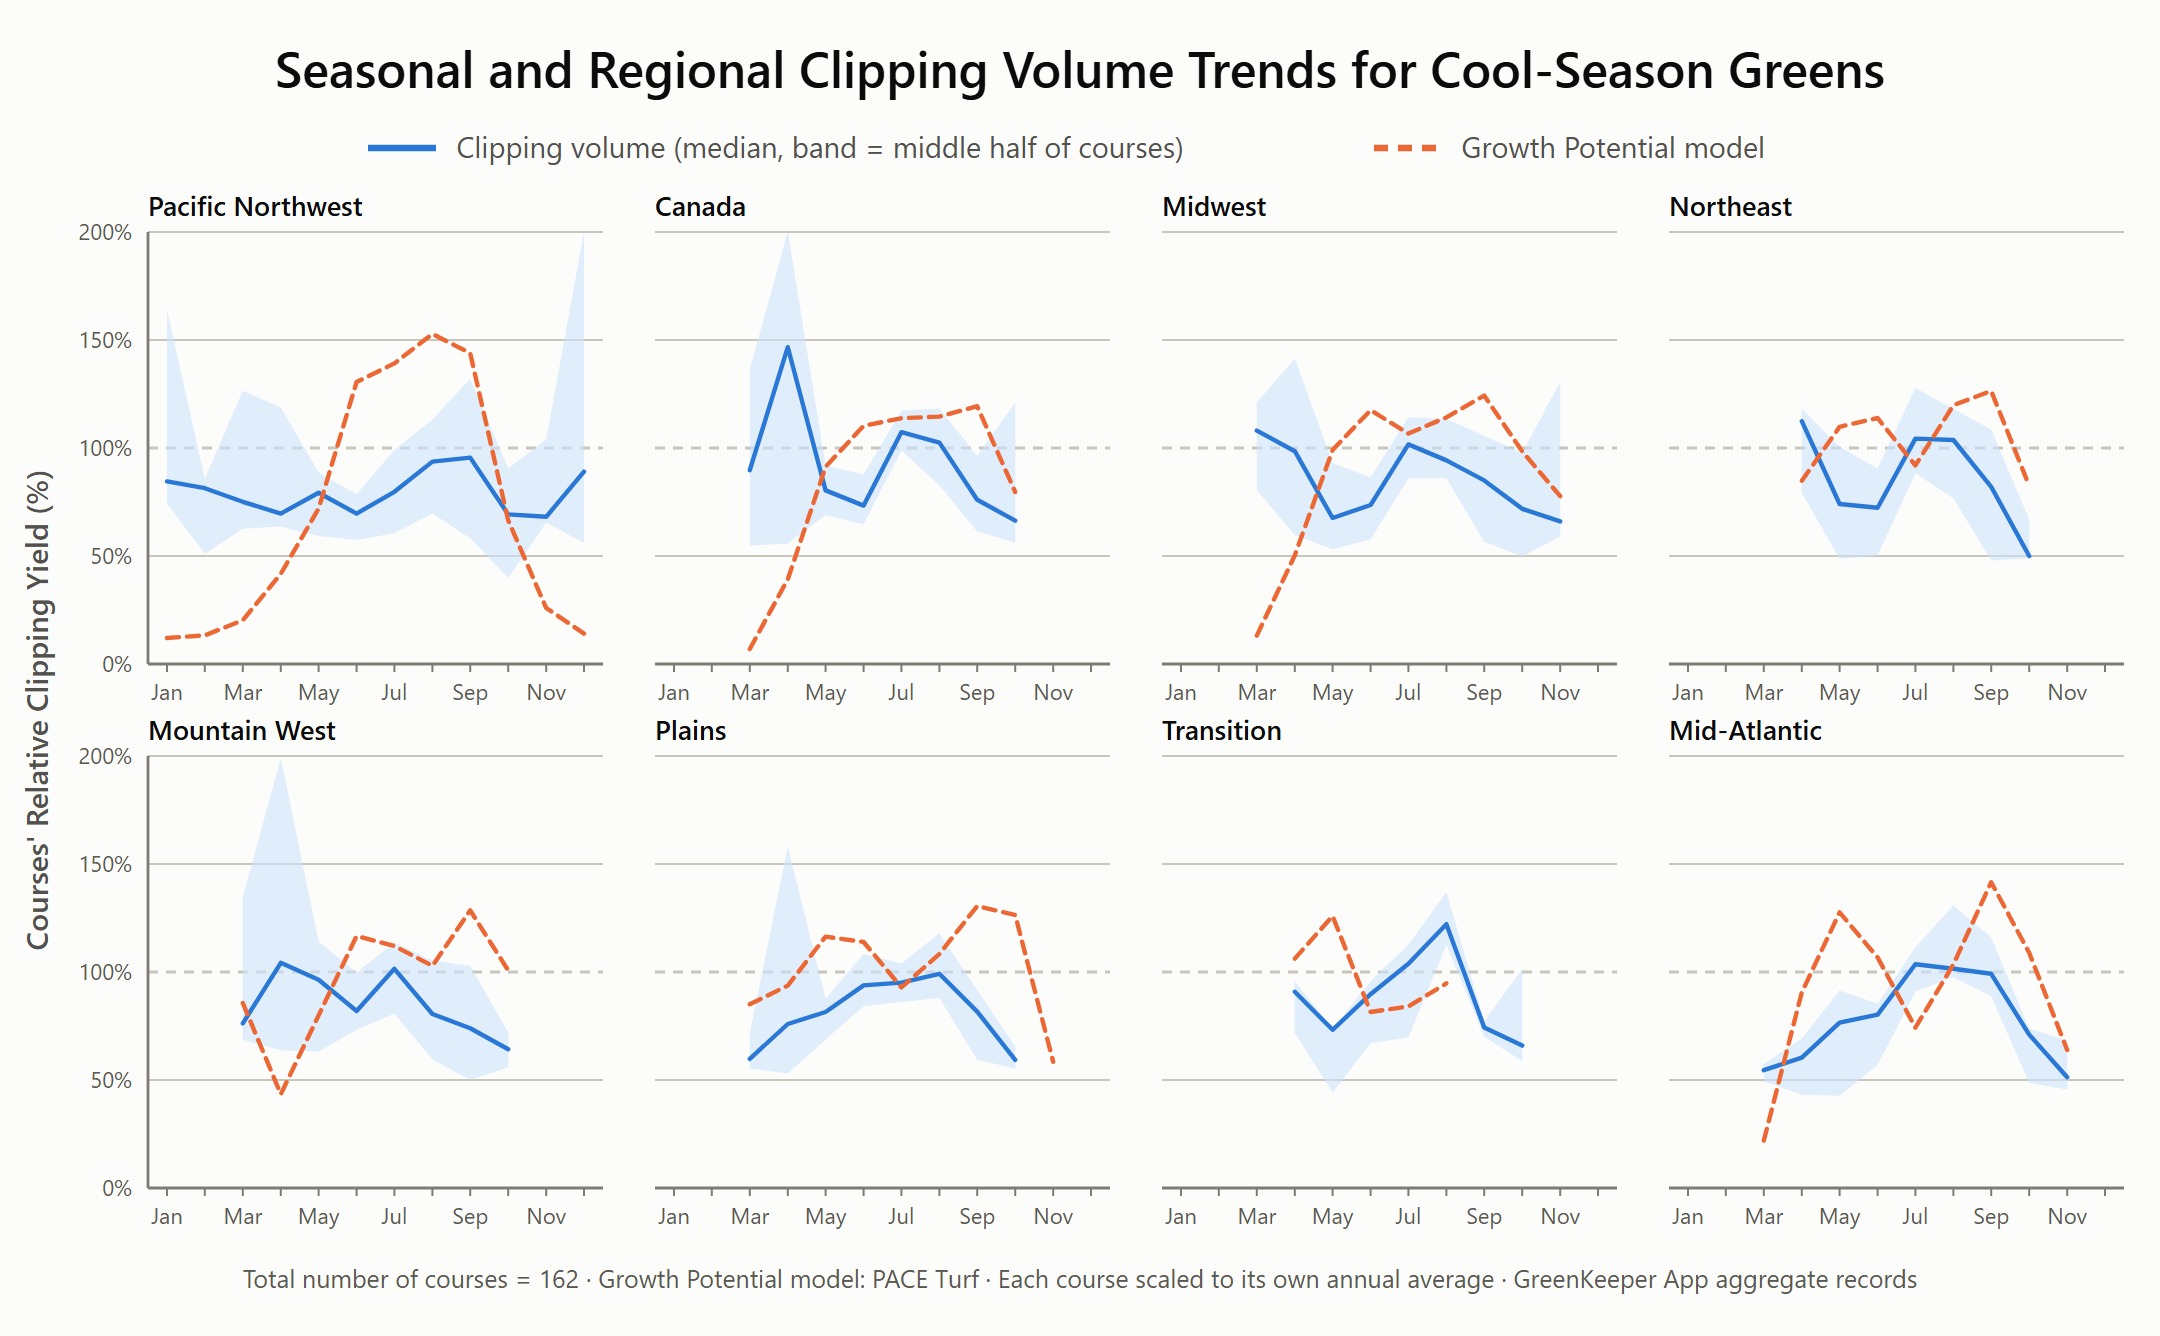
The above figure shows the broad seasonal pattern, but those averages hide some important regional differences. When each course is compared with its own normal growth, the continental cool-season regions—the Midwest, Northeast, Plains and Mountain West—show a similar spring flush followed by another increase during summer. The Pacific Northwest and Europe are flatter, with meaningful growth extending later into autumn, while California is comparatively less seasonal. Courses in the Southeast show a much stronger midsummer peak. In the Southern Hemisphere, the entire pattern flips, with courses in Australia and South Africa reaching their greatest relative growth during December through February and their lowest during July and August.
There is more than simple leaves in those buckets
There is another way to think about these numbers. At the cool-season median of 0.85 quarts per 1,000 square feet per day, a green would produce about 85 quarts of clippings for every 100 days of growth. Depending on clipping moisture and density, that represents roughly 7–11 pounds of dry plant material per 1,000 square feet. Sustain that rate across a 250-day mowing season and the mower could remove roughly 17–27 pounds of dry biomass per 1,000 square feet.
That biomass matters. Creeping bentgrass clippings commonly contain around 5% nitrogen on a dry-weight basis, meaning that amount of seasonal growth would remove roughly 0.9–1.4 pounds of nitrogen per 1,000 square feet in the clippings alone—not to mention phosphorus, potassium and other nutrients contained in the tissue. It also represents carbon and carbohydrates the plant spent energy producing before we cut them off and hauled them away. Higher growth does not just mean fuller buckets; it means greater nutrient removal, greater carbohydrate demand to replace lost leaf area, and potentially more organic matter entering the system when some of that biomass is not removed.
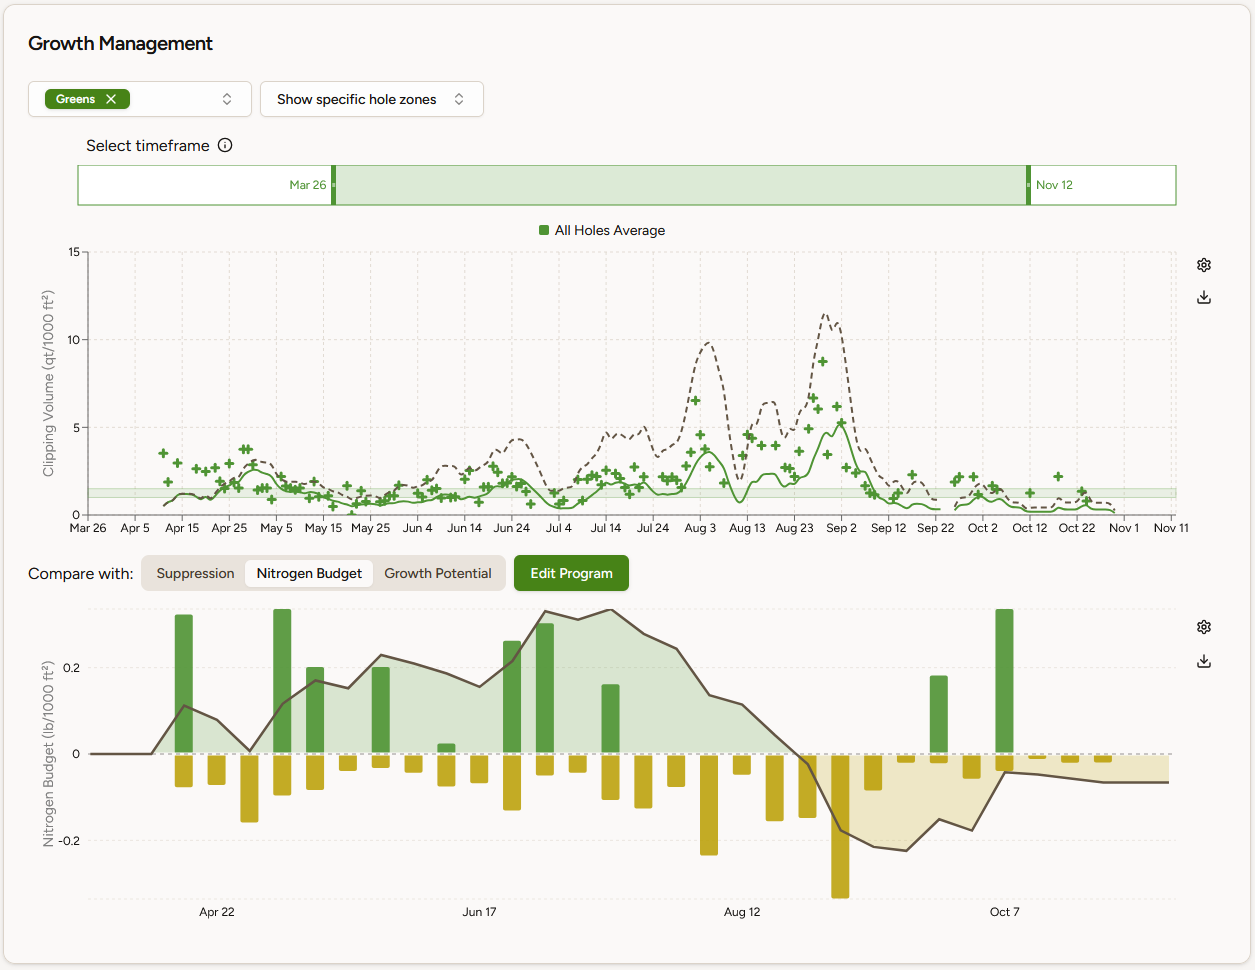
GreenKeeper users tracking clipping volume and fertilizer additions can see weekly difference in fertilizer applied versus removed in clippings on the Course Analytics page.
What about weather factors?
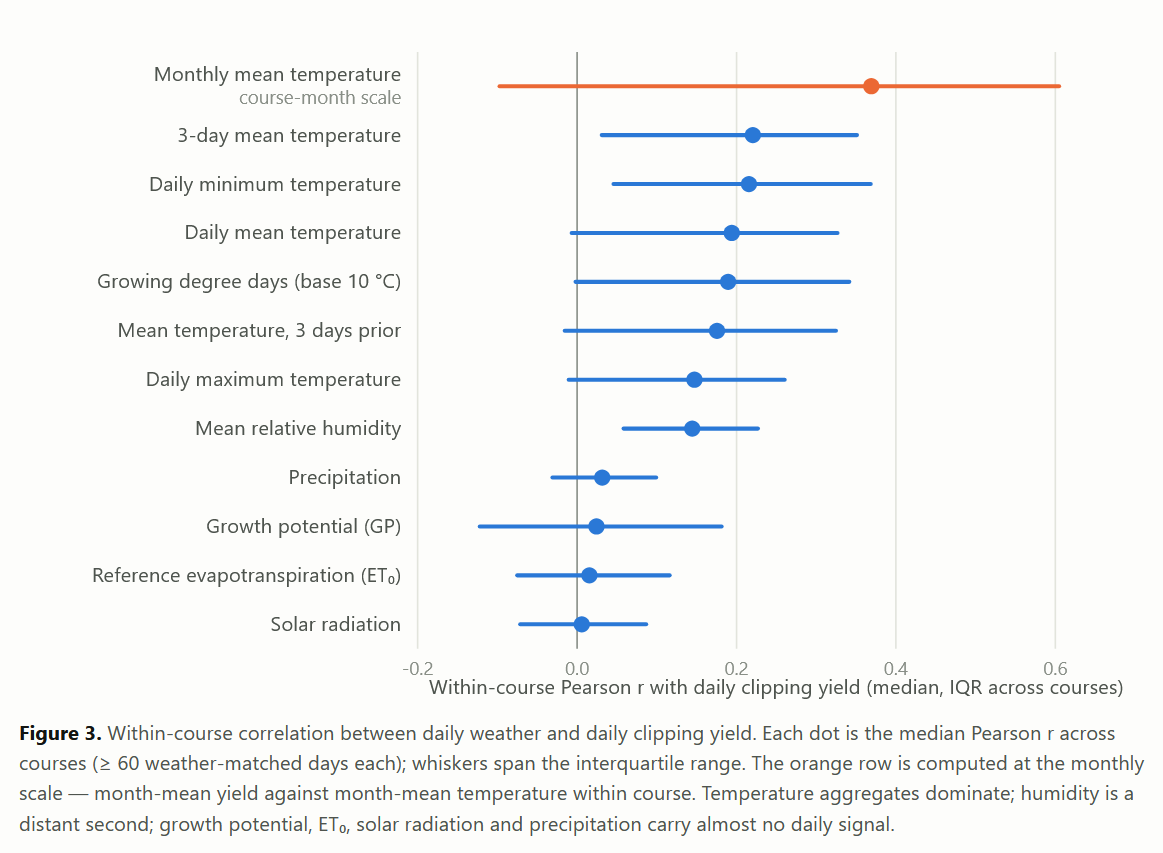
Nitrogen fertilizer and PGRs are only part of what determines how quickly those buckets fill up. Weather factors provide the environmental engine, and the GreenKeeper dataset gives us an opportunity to compare measured growth with the conditions surrounding it. Our weather-linked dataset currently begins in 2024, but some interesting patterns are already emerging. Recent temperature—particularly multi-day average temperature and minimum temperature—has one of the clearest relationships with daily clipping yield. Humidity carries a smaller signal, while precipitation, evapotranspiration, solar radiation and traditional growth potential show much weaker relationships with day-to-day clipping production.
These broad patterns are only the beginning. In the coming weeks, we will dig deeper into how specific weather conditions influence growth, how putting greens respond to nitrogen, and what nearly 40,000 PGR applications can tell us about the timing and magnitude of growth regulation. We will also look at how those responses differ among putting green species and from one golf course to another, and whether a course’s own growth history can help us better understand what is likely to happen next.
The exciting part is that none of this starts with a complicated new measurement. It starts with the same question superintendents have asked for years: “How much grass was in the buckets?” The difference is that when clipping volume is measured consistently and recorded in GreenKeeper, those daily observations begin building a growth history that can become increasingly useful for understanding and managing your own greens. If you aren’t already collecting clipping volume, now is a very good time to start.