
There are literally hundreds of soil wetting agents in the turfgrass management industry. Some are marketed to retain water while others to move it. Some claim to increase surface firmness while others supposedly reduce firmness. Labeled re-application intervals range from two weeks to three months. Are these differences real? Is there a better way to evaluate wetting agent performance? After years of research, we are excited to unveil a new wetting agent performance model. GreenKeeper App now includes guidance for timing wetting agent applications to turf soils.
What Were We Thinking?
The duration of wetting agent performance, like PGR duration, is related to temperature. Soil microbes breakdown wetting agent molecules to get energy through the process of microbial degradation. The rate of degradation depends on factors including soil moisture, aeration, wetting agent structure and soil temperature. Researchers from the University of Minnesota showed that wetting agent performance declined as temperature increased (Schwab, 2020). We hypothesized that a growing degree day (GDD) model could be used to predict when wetting agents needed to be re-applied. It was the same approach that we’ve used for fifteen years to model PGR performance. We would apply the product at different times of the year – and different locations – and make frequent measurement to see when the product stopped working.

In theory, this approach makes sense, but how do we assess wetting agent performance or longevity? For PGRs, we would measure clipping yield daily and compare it to a non-treated area of to calculate the relative growth rate (suppression or rebound). Researchers have evaluated wetting agents in many ways. Common metrics include numerous volumetric water content readings with a moisture meter, prevalence of localized dry spot during dry-down, thermal imagery from drones or mounted camera systems, and surface firmness measurements with devices like the USGA TruFirm meter. While these measurements can help distinguish differences between wetting agents on any particular day, we needed a method to see when a wetting agent stopped working.
Water Drop Penetration Tests to the Rescue
Water drop penetration tests (WDPT) are boring to run, but they are a great way to measure the hydrophobicity – water repellencey – of a soil. Basically, a small ¾” diameter soil core is removed from a turf area, it is allowed to air dry for 14+ days, and then 0.1 mL of water is placed on the side of the core. Then we simply record the time it takes for the water drop to completely infiltrate into the soil core. Wettable sand soils will have very short infiltration times and hydrophobic sands will have very long infiltration times. When a wetting agent is present, the infiltration time is short and fairly consistent from core to core. Once the wetting agent is gone – presumably from microbial degradation – there will be more variability in WDPT and the average WDPT time across all cores will increase. It is a boring test run and we needed to pull thousands of samples over several years, but the variability in WDPT times proved a great metric to model wetting agent performance.

Down to the Nitty Gritty
After five years of failure with different low- and high-tech methods to assess wetting agent longevity, we finally attempted the WDPT approach across the ten golf putting greens at Jim Ager Memorial Jr. Golf Course in Lincoln, NE. We evaluated Simplot Turf & Horticulture’s CounterAct Firm wetting agent in this trial during 2022 and 2023. This was an incredibly labor-intensive project, and we thank the Simplot T&H Performance Pack managers for supporting our quest to build a wetting agent model despite our early failures. The method was straightforward. We treated all the greens with CounterAct Firm (6 fl oz/1000 square feet) monthly and watered it in with eight minutes of irrigation. Every time the wetting agent was re-applied, we would add three new “check” plots on each of greens. At the end of the seasons, there were 15 different “check” areas that had last been treated with CounterAct Firm at different months. Throughout the season, our research team would pull soil cores from the check areas to compare WDPT times to areas that were frequently treated with CounterAct Firm. We would use those normalized scores to assess when the wetting agent appeared to stop working.

NERD WARNING: To create the model, we needed to use logistic regression to correlate the likelihood that the wetting agent was working with the number of GDDs that have been accumulated since the wetting agent was last applied. Growing degree days are calculated by adding together the daily average air temperature (Celsius) from the day the CounterAct Firm was last applied until the date of any particular core was pulled for a WDPT measurement. We also needed to calculate a base temperature where wetting agent degradation was minimal – low microbial degradation. We recalculated the models with different base temperatures and looked for a convergence point (see the image below).
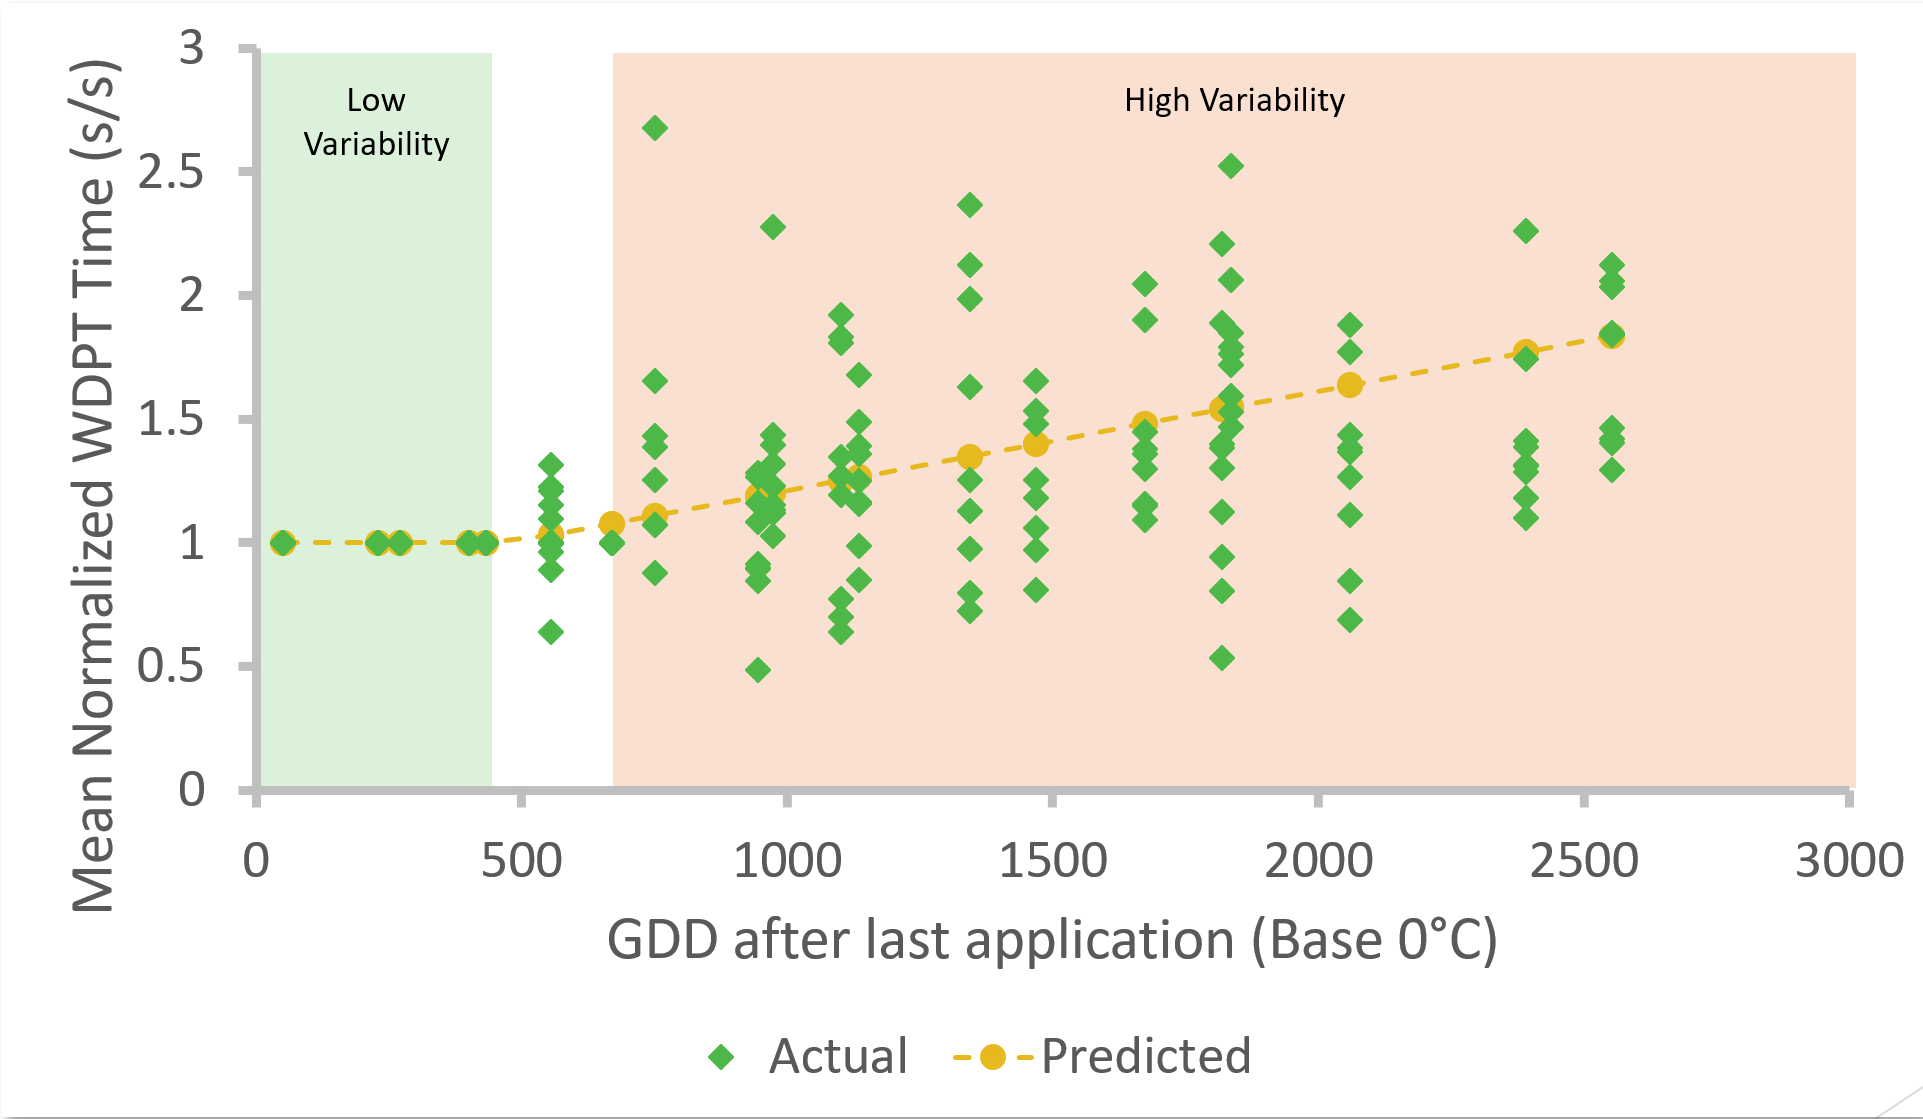
Increased WDPT variability.
The normalized WDPT time and variability increased as the CounterAct Firm was degraded over time.
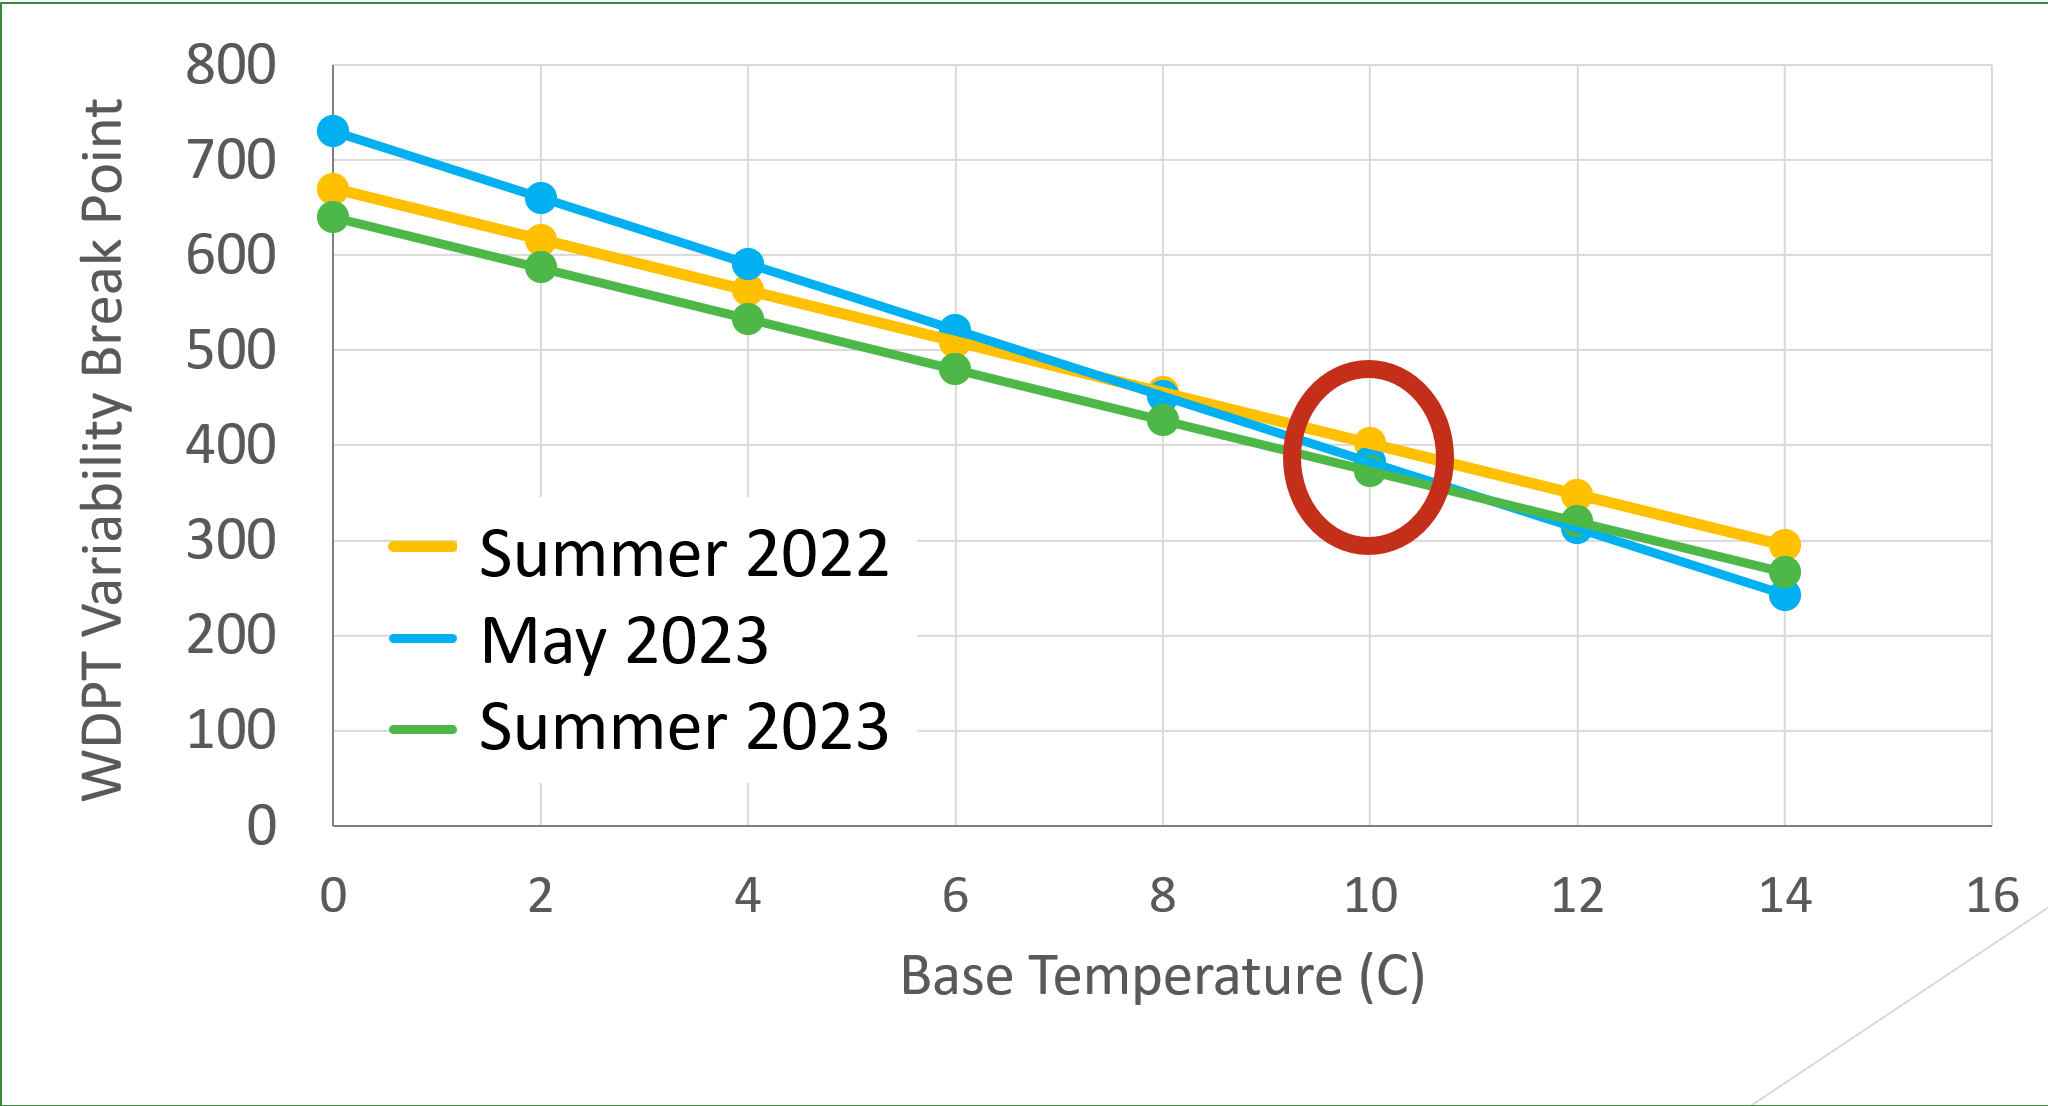
Fitting a Base Temperature
Models were re-calculated with different base temperatures. A base temperature of 10C (50F) was most appropriate for CounterAct Firm. Below this temperature, degradation would slow significantly.
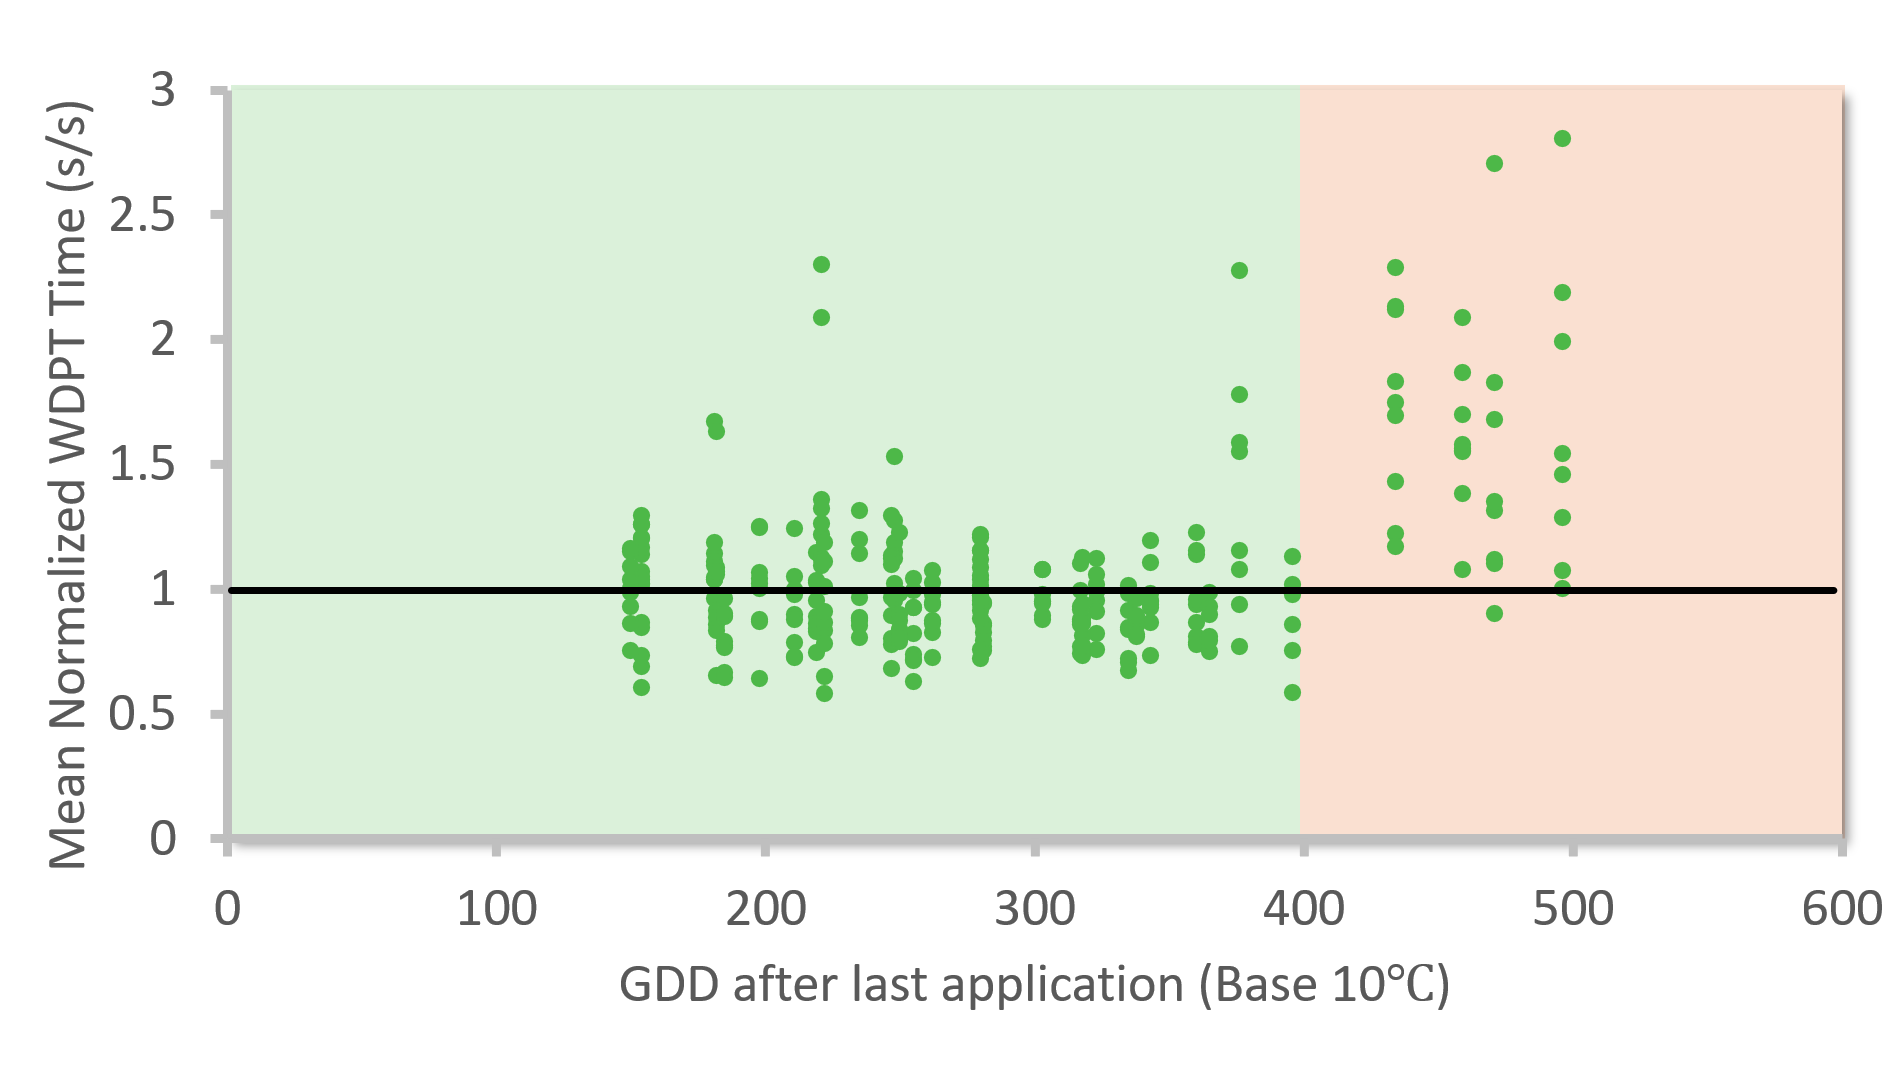
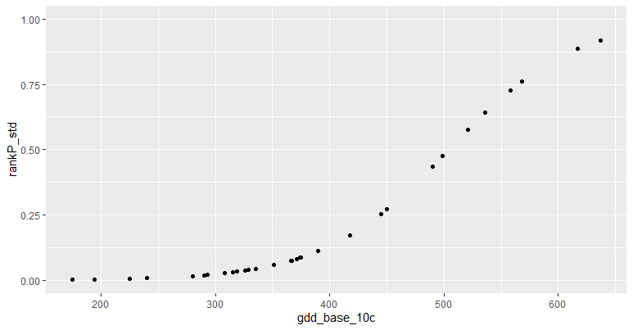
2023 Validation with 10C Base Temperature
The data from 2023 (Lincoln, NE and Madison, WI) was plotted the the new 10C base temperature. CounterAct Firm performance declined after 400 GDD.
Probability of CounterAct Firm Performance
Logistic regression was used to determine the probability of CounterAct Firm’s performance after it was applied. This model was then built into GreenKeeper App.
The End Result: It FINALLY worked! Our model provided an estimated Performance Expectation (probability) for CounterAct Firm wetting agent. The best base temperature – the temperature when microbial degradation was minimal – was determined to be 10˚C (50˚F). The 50% probability point was approximately 450 GDD when CounterAct Firm was applied at 6 fl oz per 1,000 square feet. After this point, it was statistically more like that CounterAct Firm was not working at any given location than it was working at that spot.
How Can You Use This New Model?
The Performance Expectation value is the probability that CounterAct Firm is present and working at any specific location. Imagine placing a flag somewhere on a putting green. If the Performance Expectation is 90%, then there is a 90% probability that the wettability of that spot is similar to its wettability right after CounterAct Firm was re-applied. When the probability drops to 50% it’s a coin flip. The wettability of that location is either the same as it was right after application or it is similar to the wettability of a non-treated spot. When the probability declines to 10%, then it is very likely that that spot has similar wettability to an area that was not treated with CounterAct Firm.

Note: A low Performance Expectation value doesn’t mean that all of soil is hydrophobic. Wetting agents help improve wettability of hydrophobic soil locations (lower and more uniform WDPT times), but they will have less benefit on areas that are not hydrophobic. When a wetting agent like CounterAct Firm is no longer present (low Performance Expectations) there is more variability in the WDPT times across a turfgrass surface.
Each course will need to determine their optimum re-application trigger. Some courses may be more conservative, and they will re-apply when the Performance Expectation drops to 80 or 90%. Others may try to stretch apps with longer with re-application triggers of 50-60%. This reduces wetting agernt applications and saves money. Irrigation scheduling preferences will also affect this threshold. Managers using a deep-and-infrequent irrigation approach may choose a higher threshold than managers useing light-frequent irrigation schedules. I personally would not recommend going lower than 50% and prefer to re-apply wetting agent before the Performance Expectation dips below 75%.
The Proof is in the Pictures
The new Wetting Agent Performance view in GreenKeeper App’s Program Builder has a clear display of the past, current, and future Performance Expectation for CounterAct Firm. The model uses weather records, short-term weather forecasts and 30-year weather normals to drive these calculations. When the CounterAct Firm is re-applied, the model resets to a Performance Expectation of 100%, and it continues to decline as the GDDs accumulate.
I went back in time to see how well I scheduled the CounterAct Firm applications at Ager Golf Course in 2022. I noticed that the monthly re-application intervals were too tight in spring. That wastes product and money. More importantly, the CounterAct Firm applications were too infrequent during summer. Specifically, the July and August applications should have been made a week sooner. I then checked the photo gallery on my phone. I had several images of rapid localized dry spot development on July 23rd when the CounterAct Performance Expectation fell below 50%. It happened again in early August 2023 as Expected Performance fell to 27%.

The model also shows that CounterAct Firm applied during fall has the potential to linger in the soil throughout fall and winter. In September 2021, we applied CounterAct Firm to the bentgrass fairways at Ager GC. The following winter was very dry and there was widespread winter desiccation injury throughout the region. The areas that were treated with CounterAct Firm had limited damage compared to the non-treated areas of fairway. This is was likely because the soil temperatures fell below 50F and microbial degradation of the CounterAct Firm was very low.

Lots of Future Research Ahead
We are thrilled with our results so far. Our results have been replicated by Dr. Doug Soldat in Madison, WI during 2023. The data from his team aligned well with the models we created in Lincoln, NE regardless of time of year.We are confident this approach can help differentate the performance of soil wetting agents in the turf market.
We plan to use this method to evaluate different wetting agent chemistries, wetting agent mixtures, the effect of application rate and soil type on wetting agent duration and performance, and determine if wetting agents can be applied too frequently – think PGR stacking/over-regulation.
These new models will be built into GreenKeeper App, as we venture forward. Just like the PGR models, it will take years of research to get a more complete picture, but we are excited to see where we can take wetting agent modeling. Please consider joining GreenKeeper App to help support continued model development and to improve your wetting agent scheduling in the future.
Already have a GreenKeeper App subscription? Click here to see the wetting agent model in Program Builder.
Reference:
Schwab, Ryan. 2020. Improving Water Conservation On Golf Courses Through Wetting Agents And Unmown Roughs. Retrieved from the University of Minnesota Digital Conservancy. https://hdl.handle.net/11299/215027.