
For years, golf course superintendents have asked the question to their greens mowing crew, “How much grass did you get today?” Common answers usually included “a lot” or “a little” or maybe more precisely how many times they needed to dump the mower buckets. But have you ever wondered how much would have been there if PGRs were not applied?
Many golf course superintendents, and now even sports field managers, are quantifying growth rate. Clipping volume measurements are one of the most import metrics that I actively seek every morning. Are the greens growing too fast, too slow, or just right? This Goldilocks approach helps me schedule management like topdressing frequency, the need to double mow and/or roll and also schedule PGR applications.
When it comes to PGRs, their effects are always relative to what WOULD have happened PGRs were not applied. Since golf courses rarely have a non-treated green, it can be difficult to know how a PGR is working. GreenKeeper App helps with this. Our 15 years of proprietary PGR/DMI modeling research has helped turf managers answer this essential question. And the answer to this riddle is important when determining how much growth suppression is appropriate.
For example, the Penncross putting surfaces at Jim Ager Jr Golf Course in Lincoln, NE are best when we are removing approximately 1.0 qts of wet clippings per 1000 square feet (10 mL per square meter). I frequently use GreenKeeper App’s growth view to predict the combined growth suppression of various PGR and DMI combinations. Estimating the clipping volume without the PGR helps me determine how much suppression is needed at any time. For example, if the clipping volume was 2.0 qts today with 50% growth suppression from PGRs, then the No PGR ClipVol would have been around 4.0 qts per 1,000 square feet. In that scenario, it would have been better to have 75% suppression to get closer to the 1.0 qt growth rate goal. If the growth rate was 1.5 qts today with 50% suppression, then the no PGR growth rate would have been closer to 3.0 quarts and 67% suppression would be ideal.
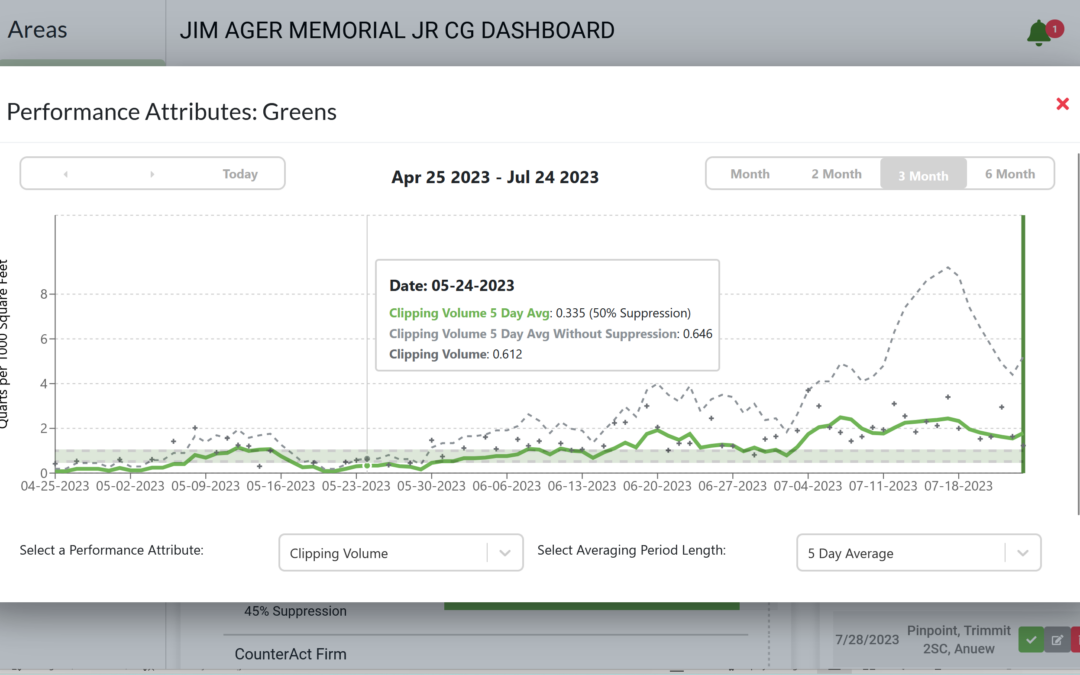
The new Performance Tracker graph view on the GreenKeeper App homepage helps users estimate the potential – no PGR/DMI – clipping volume. This can be crucial when planning PGR applications. It’s easy to access. Scroll to the Performance Tracker tile on the homepage and click the graph icon. It will launch this new view. Select values like clipping volume or green speed to see the daily value, and toggle between the different moving averages (3, 5, or 7-days). Hover over the days to see the amount of suppression from PGRs and DMI fungicides.
We have been getting regular rain in Lincoln with moderate summer temperatures and higher relative humidity. It is a welcome change after two years of exceptional drought. By tracking clipping volume from 2 or 3 greens each day, I can see the clipping volume surge, despite regular applications of Trimmit 2SC with Anuew at moderate application rates. The NO PGR GROWTH RATE WOULD BE APPROACHING 9.0 qts per 1,000 square feet during this weather. That’s a ton of unwelcome growth. In response, I’ve tightened PGR intervals to “stack” applications and have also increase the Trimmit 2SC rates to suppress the surge. While my ClipVol is still above my “normal” range, the PGRs and additional rolling have helps to sustain green speed values in the 10-11 foot range. Data and clipping volume collection during this period have been critical to sustain acceptable/”in range” green speed values.
Could this growth spike been predicted? I think so. That’s why we are investing in machine-learning models to help predict growth rate from your own clipping data. In my next blog post, I’ll show how we’ve used past Ager GC clipping yield data to build a predictive growth model for guiding application of fertilizer and PGR. For now, I’d encourage everyone to start logging ClipVol in GreenKeeper and see what their growth rate would have been without the PGRs.