
The word is getting out. Data collection and analysis can improve turf management efficiency. The team at GreenKeeper are excited to bring artificial intelligence and mower-mounted sensors to the turf management industry in 2023. These forms of data and analysis will help transform turf management decision-making. But not all data needs to be high-tech or futuristic to guide management today. Likewise, not all high-tech data sources generate actionable data. Much of the most actionable data in turf management can be generated with simple equipment. Here are some low-tech ways to collect very actionable data to improve management precision.
First, Consistent Sampling is Key
Regardless of the type of data being collected, frequent and consistent sampling are required to maximize success. Data allow managers to compare a response across locations and dates. Altering sample locations from day to day, month to month, or year to year limits the ability to measure change over time.
Example: Soil testing is going to be used the assess the efficiency of a fertilization program each spring. The goal is to maintain sufficient soil test nutrient levels from year-to-year. Measure the same representative areas to the same sampling depth and use the same testing lab to make those comparisons. If soil test levels for a particular nutrient declined after a year, then more fertilizer containing that nutrient should be applied the next year – we’ll have more on nutrient ratios in a future blog. This determination would not be possible if sampling protocols, locations, and time of year were not preserved.
Record Visual Observations
Human eyes are incredible tools that greenkeepers have been using for decades to observe turfgrass responses to factors such as management inputs and weather changes. Transform daily observations into actionable data by writing them down. Then look for trends that can be related back to management. Turf color and quality can vary from day to day based on many factors. Writing down these observations and looking for trends minimizes the risk of being too reactionary.
How To: Generate a rating scale to describe different factors. Visual turfgrass quality rating is a rating system that is frequently used by researchers to describe visual turf quality. Turf color, density, texture, uniformity, etc. are used when deciding on a visual quality rating. Researchers use guidance from NTEP to rate turf quality – 1-9 scale where 1 is dead, 9 is perfect, and 5 or 6 is minimally acceptable – but that scale can be simplified to fit the needs of your course (i.e. 1-4 stars). Define your scale and rate turf quality frequently to observe trends. It is best to rate the same representative locations during the year. Even better, rate an area(s) that performs best and area(s) that perform worst ever year to have “side-by-side” comparisons.
Example: Turfgrass visual quality rating is used to adjust nitrogen application rates. If the turf is not meeting expectations for quality (density, color, uniformity), then N application rate will be increased when spoon-feeding. Small increases in N fertilizer can dramatically improve turfgrass quality and have a marginal impact on growth rate when quality rating is low.
Measure Growth Rate
Measuring growth rate through collection of clipping volume from a couple greens everyday. Growth rate is directly related to turfgrass quality, putting green performance, nutrient requirements and stress tolerance. When growth rate is low, green speeds may be high but turfgrass quality rating may suffer. Too much growth can slow green speeds and accelerate nutrient and sugar removal. This reduces turf resilience when exposed to stress. Fortunately, a high growth rate can be easily suppressed with plant growth regulators.
Measuring growth rate through clipping volume allows managers to more precisely establish growth rate goals. Managers can then adjust management to achieve those goals. Clipping volume collection can also be used to estimate nutrient removal during mowing – a powerful metric to judge a fertilization program against.
How-To: Not much sophistication required here, only a bucket (approximately three to five gallons) with gradations on the side. Clear stock buckets from a kitchen supply store work great. When emptying the mower baskets, pour the clippings into the measuring bucket and record the total volume. The raw volume needs to be normalized to the green size. Common units include liters per 100 square meters and quarts per 1,000 square feet. Both are nearly equivalent relative to the accuracy of the measurement. Some metric users also prefer milliliters per square meter (10x greater than L/100 m2). Collect 12 quarts of clippings from a 4,000 square foot green and get a ClipVol of 3.0 qts./1,000 sq. ft.
As with turf quality, it is best to measure the same areas each day instead of doing different greens daily. Clipping volume can be variable from day to day, so calculating the seven-day average is the best way to monitor changes in growth rate. Add all the daily volumes together from the past seven days and divide by seven days to get the moving average. Skip a day? Don’t worry, you’ll capture it the next day you mow and the seven-day moving average won’t be affected.

Example: Many golf course superintendents find a growth rate of approximately 1.0 qts. per 1,000 square feet produces sufficient growth to recover from traffic and sustain acceptable turf quality and still produce acceptable green speeds. Monitor the seven-day average growth rate to adjust nitrogen and PGR application rates to hit a desired growth rate. When growth rate is 2.0, 50% growth suppression from a PGR program is required to hit growth rate goals. Entering the ClipVol into GreenKeeper shows superintendents the expected growth rate without the effects of PGRs and DMIs. This is helpful when determining the amount of growth suppression is required.

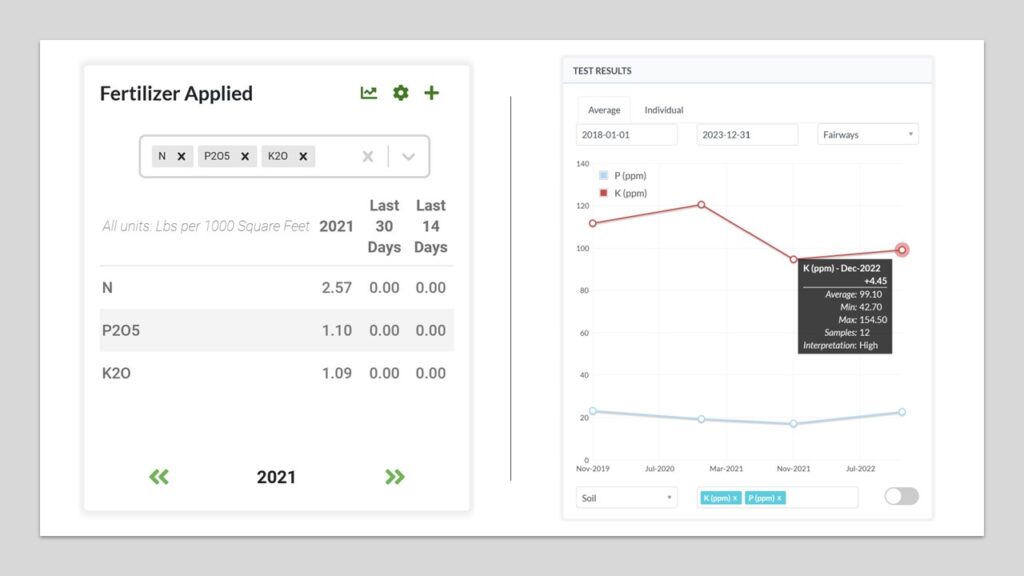
In addition to managing daily growth rate, measuring cumulative clipping volume allows superintendents to estimate total nutrient removal. This value can be used to assess the efficiency of a fertilizer program. At Jim Ager GC in Lincoln, NE an aggressive PGR program was used to suppress yield by and average of 80%. Over 3 lbs of nitrogen per 1,000 square feet were required to sustain an acceptable clip vol at that level. At the end of the 2021, only one pound of nitrogen was removed in the clippings. It was a backwards way of managing growth and fertilizer. In 2022, visual quality was used to dictate nitrogen applications and PGRs were used to suppress excessive clipping volume. At the end of the year, nitrogen additions roughly matched N removal. At the end of the year, nitrogen additions roughly matched N removal. It can be normal for there to be differences from year to year, but large differences over many years can represent management inefficiency.

Optimizing Nutrient and PGR Applications
Use of visual turf quality ratings, frequent clipping volume measurements, and soil test results together can provide powerful data to manage nutrient and PGR applications. Under normal management conditions, nitrogen fertilizer additions can dramatically improve turfgrass color and density. Use this visual quality rating to schedule nitrogen applications. If small additions of N fertilizer increase clipping volume above your goal, then increase PGR application rates or mix different PGRs together to increase relative suppression. At the end of the growing season, study the nutrient removal display in GreenKeeper and compare it to the fertilizer summary? How did that difference change soil test values? Is more or less of each nutrient needed next year based on this change. Remember, increased growth rate also increases nutrient requirements and removal of all nutrients. Think of the soil test reports as a bank account where fertilizer represents the deposits and clipping yield represents the withdrawals. This mass balance approach can be helpful to generate soil test recommendations. In conjunction, these simply data points can transform your growth management program.
Other Simple Data Points
There are obviously many other data sources and techniques that can be used to drive turfgrass management decisions. We’ll cover many of them in subsequent blog posts. Part II of this post will highlight moisture meters, Stimpmeters and organic matter testing. We’ll also have posts covering new technologies including crop and soil sensors, drones, GPS sprayers, and more. Be sure to follow our blog to receive alerts when these new articles are posted. For now, start using simple data collection methods to transform your turf management program.
Trackbacks/Pingbacks